









In today’s highly competitive and evolving car wash industry, success hinges not just on excellent service but on smart, data-driven decision-making. For car wash business owners and operators, relying solely on intuition or anecdotal evidence is a recipe for stagnation. This is where Key Performance Indicators (KPIs) become indispensable tools, offering a quantifiable lens through which to evaluate every facet of your operation – from customer engagement to financial health.
By diligently tracking and analyzing specific KPIs, car wash businesses can gain actionable insights, pinpoint areas ripe for improvement, optimize resource allocation, and ultimately, pave a strategic path toward sustained profitability and growth. This comprehensive guide delves into five core KPIs that every car wash service, whether traditional or eco-friendly, should meticulously monitor to thrive in the modern market. We will explore their definitions, strategic advantages, potential drawbacks, industry benchmarks, and actionable strategies for enhancement.
| # | KPI Name | Description |
|---|---|---|
| 1 | Average Revenue Per Wash | Measures the income per wash service, revealing the effectiveness of pricing strategies and upselling efforts. |
| 2 | Water Usage Efficiency | Tracks the volume of water used per vehicle, ensuring cost control and promoting eco-friendly operations through advanced water-saving technology. |
| 3 | Service Cycle Time | Evaluates the time taken to complete a wash, impacting customer satisfaction and helping optimize scheduling for both fixed and mobile services. |
| 4 | Customer Retention Rate | Indicates the percentage of repeat customers, reflecting service quality, competitive pricing, and effective loyalty initiatives. |
| 5 | Gross Profit Margin | Assesses profitability by subtracting costs, such as water and labor, from revenue, serving as a key metric for operational efficiency and financial health. |
KPI 1: Average Revenue Per Wash
Definition
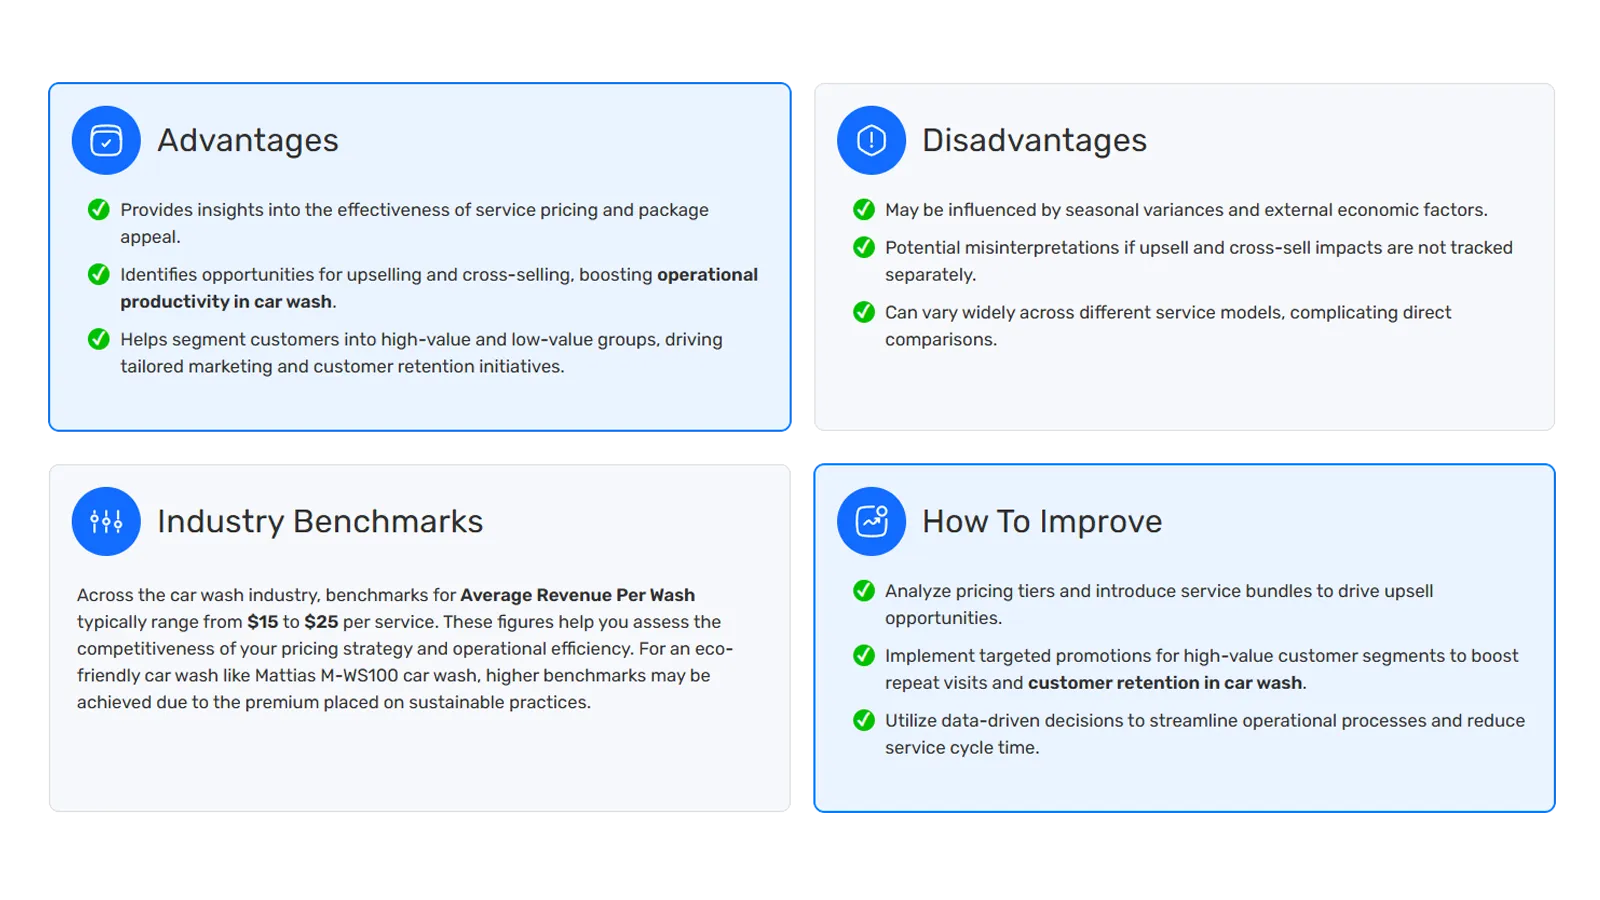
The Average Revenue Per Wash (ARPW) KPI represents the typical income generated from each car wash service transaction. This metric transcends the mere base price of a wash by encompassing revenue from all additional services, upgrades, and ancillary purchases (such as vending machine items or loyalty program fees, if attributed per wash) associated with a single customer visit. It serves as a vital indicator for assessing the effectiveness of your pricing architecture, the success of your upselling and cross-selling strategies, and the overall profitability derived from each customer interaction.
Advantages
Tracking ARPW offers profound insights into the financial performance of your core offerings. Firstly, it provides clear data on the effectiveness of your service pricing and the appeal of your wash packages. If your ARPW is consistently high, it suggests that customers perceive value in your mid-to-high tier washes or feel compelled by your additional offerings. Secondly, ARPW actively identifies opportunities for upselling and cross-selling, thereby boosting operational productivity and maximizing the value of each customer touchpoint. Understanding which upgrades contribute most to this average can inform future package development and marketing efforts. Lastly, by correlating ARPW with customer demographics, it helps segment customers into high-value and low-value groups, facilitating tailored marketing and customer retention initiatives. This allows for more precise targeting of promotions and loyalty programs.
Disadvantages
While powerful, ARPW has its limitations. It may be influenced significantly by seasonal variances (e.g., more premium washes in winter due to salt removal, or more basic washes in summer) and broader external economic factors, such as inflation or discretionary spending habits. A general economic downturn, for instance, could lead customers to opt for lower-cost washes. Additionally, if the impact of individual upsell and cross-sell components isn’t separately tracked, there’s potential for misinterpretation, masking the performance of specific offerings within the aggregate. Lastly, ARPW can vary widely across different car wash service models (self-serve, automatic, full-service), complicating direct comparisons without proper contextualization.
Industry Benchmarks
Across the diverse car wash industry, benchmarks for Average Revenue Per Wash typically range from $15 to $25 per service per wash), but higher for full-service options. Eco-friendly car wash businesses, such as a “Mattias M-WS100 car wash” (as suggested in the prompt), might aim for higher benchmarks due to the premium associated with sustainable practices and often superior cleaning results, appealing to an environmentally conscious clientele. For instance, membership plans, a growing trend, can yield an average of $30 per member monthly.
How To Improve
Enhancing ARPW involves a multi-faceted approach. First, analyze your existing pricing tiers and introduce or refine service bundles to intuitively guide customers toward higher-value packages through perceived value. Second, implement targeted promotions specifically designed for identified high-value customer segments to incentivize repeat visits and enhance customer retention. This might involve exclusive discounts on premium services. Third, utilize data-driven insights to streamline operational processes and reduce service cycle time, enabling your staff to more efficiently handle additional services or upsell opportunities without creating bottlenecks. Finally, invest in ongoing staff training focused on suggestive selling techniques and effective communication of value propositions for premium services.
How To Calculate
To calculate Average Revenue Per Wash, simply divide the total revenue earned by the total number of wash services delivered within a specific period:
Total Revenue ÷ Number of Washes = Average Revenue Per Wash Example of Calculation
Consider M-WS100 Clean Car Wash. If it generates $4,000 in total revenue from 200 wash services within a month, the calculation for Average Revenue Per Wash would be:
$4,000 ÷ 200 = $20 per washThis calculation directly reflects the average contribution of each customer transaction to ws100’s overall revenue and informs how effective current pricing and upsell strategies are in contributing to overall profitability.
Tips and Tricks
-
Regularly review pricing strategies to ensure they remain competitive while maximizing perceived value in your specific market, particularly if operating in the eco-friendly car wash segment.
-
Continuously monitor upsell performance, adapting additional service offerings based on observable customer demand and preferences.
-
Leverage detailed sales reports to track daily, weekly, or monthly variations in ARPW, identifying emerging trends and seasonality.
-
Integrate customer satisfaction metrics to establish a clear correlation between the quality of service delivery and its impact on revenue outcomes. High satisfaction often encourages premium service selection.
KPI 2: Water Usage Efficiency
Definition
Water Usage Efficiency (WUE) is a critical Key Performance Indicator that quantifies the volume of water consumed per vehicle serviced. This metric holds particular significance for environmentally conscious operations like eco-friendly car washes. Tracking WUE is paramount for achieving several strategic objectives: maintaining rigorous cost control by optimizing utility expenditure, ensuring peak equipment performance through proper calibration, and guiding employee training initiatives to significantly reduce water waste and foster a culture of conservation. It’s a direct measure of both operational prudence and environmental stewardship.
Advantages
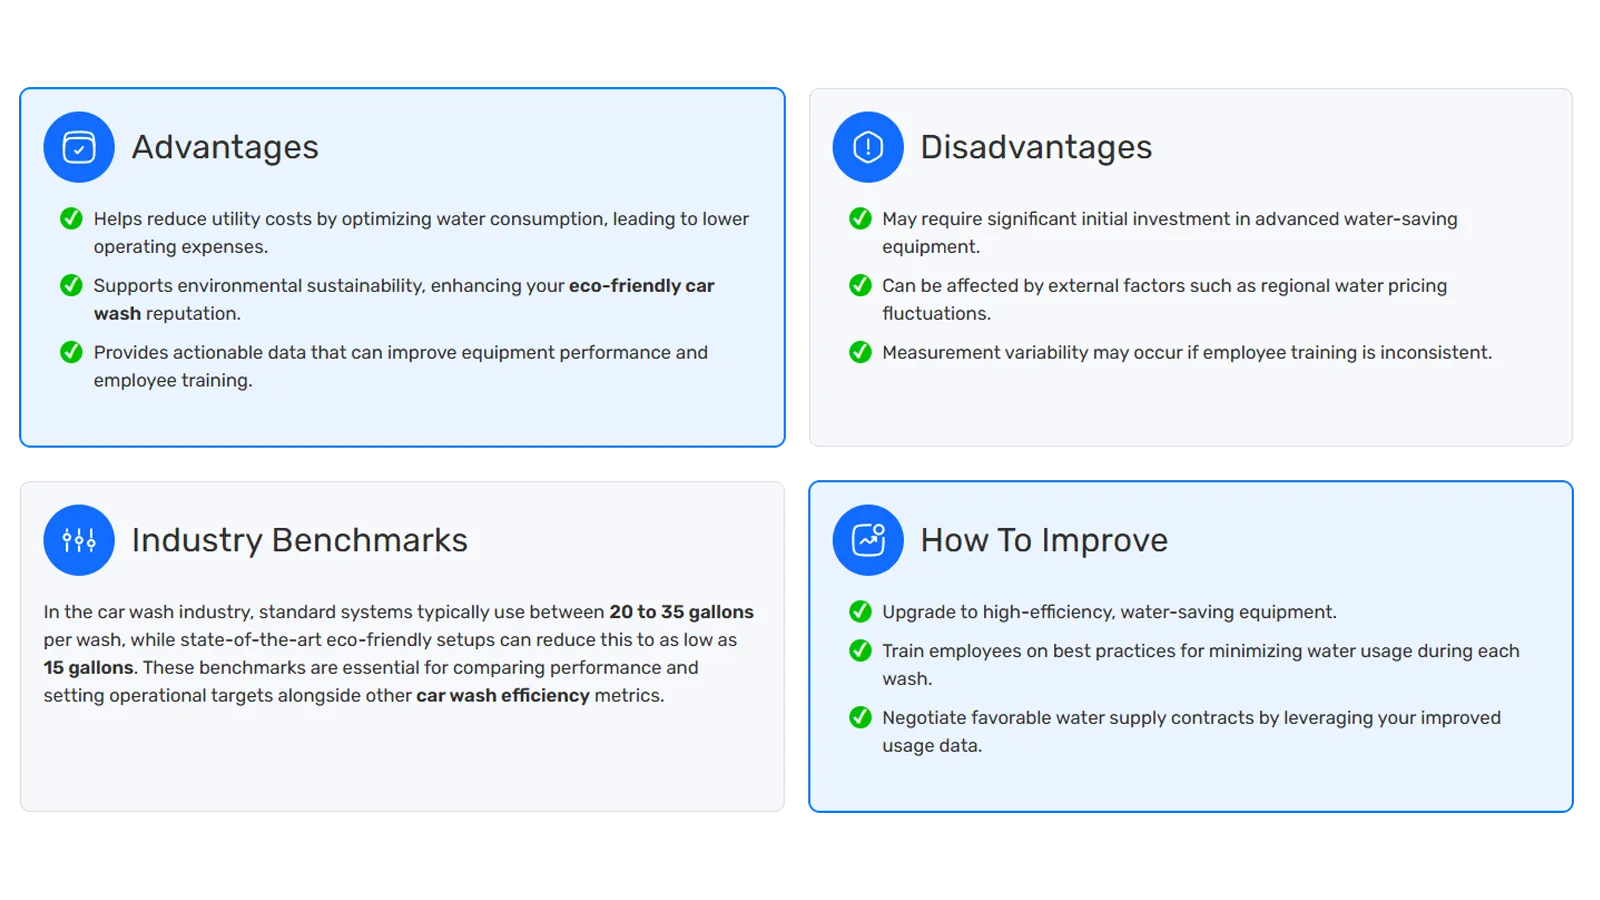
Optimizing Water Usage Efficiency delivers substantial operational and reputational benefits. Firstly, it directly helps reduce utility costs by optimizing water consumption, leading to a tangible decrease in overall operating expenses. Given the rising cost and increasing scrutiny of water resources, this financial advantage is increasingly important. Secondly, a strong focus on WUE supports environmental sustainability efforts, which in turn significantly enhances your eco-friendly car wash’s reputation. Customers are increasingly seeking out and rewarding businesses that demonstrate a clear commitment to environmental responsibility. Finally, the data derived from tracking WUE provides actionable insights that can be utilized to improve equipment performance through recalibration or upgrades, and to refine employee training programs focused on water conservation best practices.
Disadvantages
While the advantages are clear, implementing and optimizing WUE can present challenges. It may necessitate a significant initial investment in advanced water-saving equipment, such as reclamation systems, high-efficiency nozzles, or reverse osmosis units. The long-term savings generally justify this, but it requires upfront capital. Furthermore, WUE can be influenced by external factors like regional water pricing fluctuations or drought conditions that impose mandatory usage restrictions. Finally, measurement variability may occur if employee training is inconsistent, leading to discrepancies in water usage between staff members or shifts if not tightly controlled and monitored.
Industry Benchmarks
Industry benchmarks for water usage illustrate a stark contrast between conventional and optimized systems. Standard car wash systems typically use between 20 to 35 gallons (approximately 75-132 liters) of water per wash. However, modern, state-of-the-art eco-friendly setups, especially those employing advanced water reclamation and recycling technologies, can significantly reduce this figure to as low as 9-15 gallons (approximately 34-57 liters) per vehicle. Some innovative dry wash systems use minimal water, even 50 ml per car. These benchmarks are crucial for performance comparison, setting ambitious operational targets, and validating your car wash’s commitment to sustainability. In contrast, washing a car at home typically consumes far more, ranging from 40 to 140 gallons per vehicle, with the untreated runoff directly impacting local environments.
How To Improve
Significant improvements in Water Usage Efficiency can be achieved through targeted strategies. The most impactful is to upgrade to high-efficiency, water-saving equipment, including low-flow nozzles, high-pressure washers, and robust water recycling and reclamation systems. Second, conduct regular, comprehensive staff training programs focused on best practices for minimizing water usage during each step of the wash process. This includes correct equipment operation and leak identification. Third, by consistently demonstrating improved water usage data, you can negotiate more favorable water supply contracts with utility providers, leveraging your efficiency as a bargaining chip.
How To Calculate
To calculate Water Usage Efficiency, divide the total volume of water used (in gallons or liters) by the total number of vehicles washed within a specific operational period:
Total Gallons Used / Total Vehicles Washed (or Liters)Example of Calculation
If M-WS100 Clean Car Wash, a modern, eco-friendly facility, uses 1500 gallons of water to service 100 vehicles in one day, the Water Usage Efficiency would be calculated as:
1500 Gallons / 100 Vehicles = 15 Gallons per VehicleThis exceptional efficiency level not only demonstrates M-WS100’s strong commitment to cost management but also reinforces its leading position in environmental sustainability, making it an attractive choice for eco-conscious consumers.
Tips and Tricks
-
Regularly monitor water usage through utility meters and equipment sensors to swiftly identify and rectify any inefficiencies or potential leaks.
-
Invest proactively in comprehensive staff training programs that prioritize water conservation techniques and responsible equipment operation.
-
Benchmark your water usage data against both industry standards and your own historical performance to set realistic, yet ambitious, improvement targets.
-
Integrate your water efficiency metrics with financial reporting, analyzing them alongside revenue data to fully understand their impact on overall car wash profitability. This highlights water savings’ direct contribution to the bottom line.
KPI 3: Service Cycle Time
Definition
Service Cycle Time measures the total duration required to complete a standard car wash service for a single vehicle, commencing from the point of entry and concluding at exit. This KPI is fundamentally critical for assessing operational efficiency and has a direct correlation with customer satisfaction. Beyond this, it serves as an invaluable tool for informing essential scheduling decisions, optimizing resource allocation, and ultimately, enhancing the overall profitability of the car wash operation. It’s a testament to how smoothly your car wash processes vehicles.
Advantages
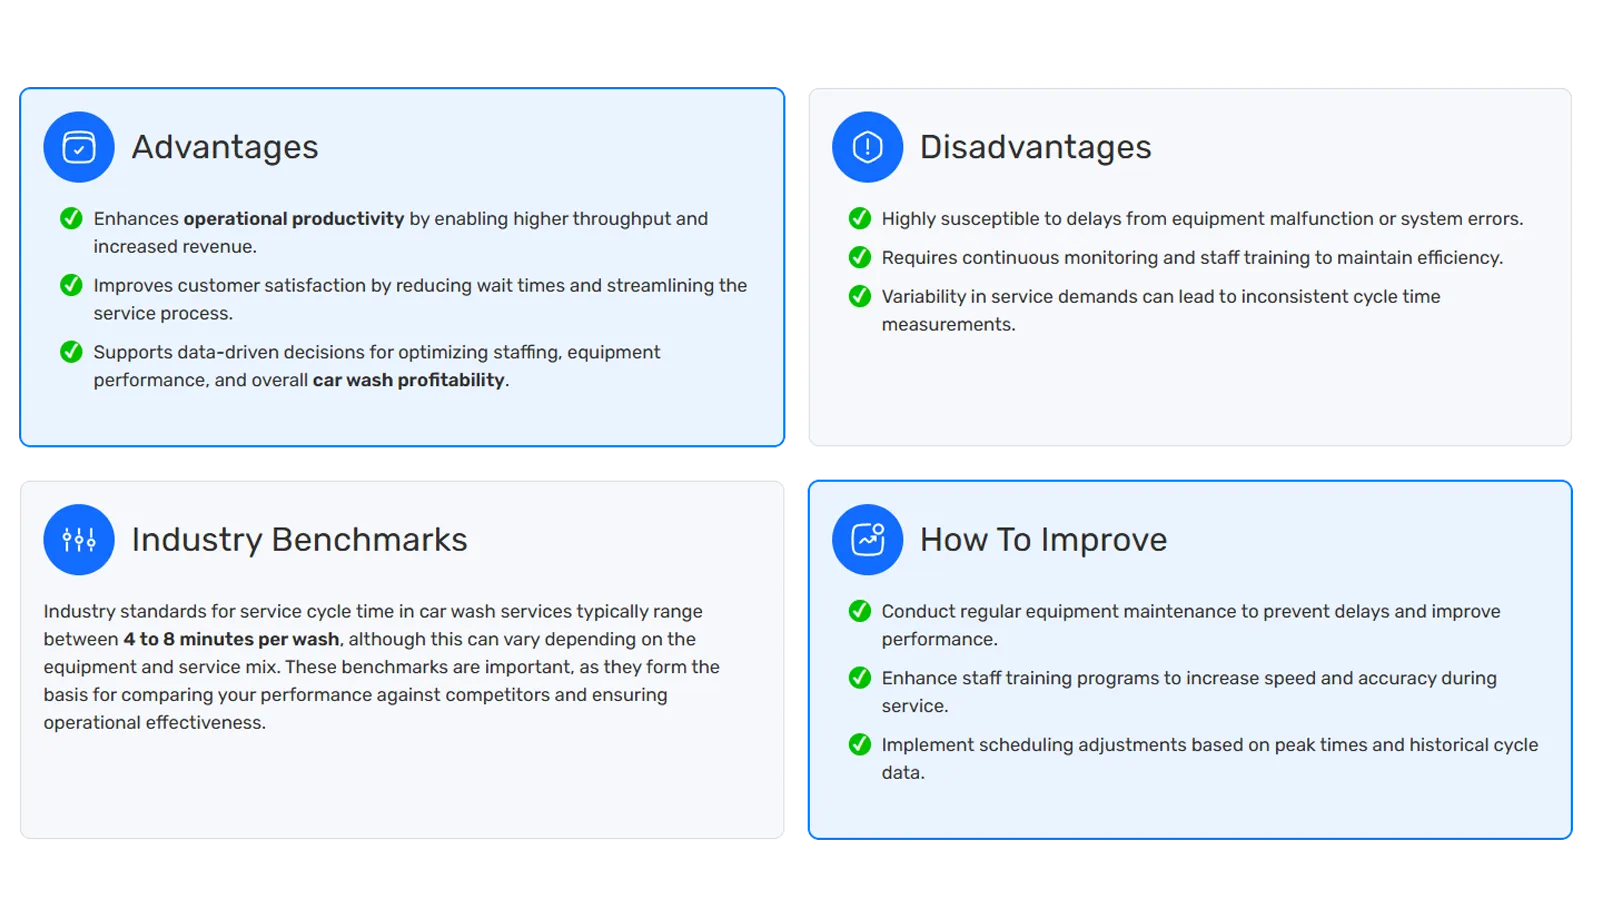
Optimizing Service Cycle Time brings about significant benefits for any car wash. Firstly, it enhances overall operational productivity by enabling a higher throughput of vehicles, which directly translates into the potential for increased daily revenue. A faster service means more cars can be washed within a given operational window. Secondly, by actively reducing wait times and streamlining the service process, it substantially improves customer satisfaction. In a fast-paced world, speed and convenience are paramount for customers. Thirdly, the data garnered from Service Cycle Time measurements supports data-driven decisions for optimizing staffing levels, assessing equipment performance, and fine-tuning the entire operational workflow to maximize overall car wash profitability.
Disadvantages
Despite its importance, relying solely on Service Cycle Time as a KPI can present challenges. It is highly susceptible to delays caused by equipment malfunctions, sensor errors, or software glitches, any of which can drastically inflate the average time and skew metrics. Maintaining efficiency requires continuous monitoring and consistent staff training to ensure that procedures are followed uniformly and efficiently. Moreover, variability in service demands, such as unexpected surges during peak hours or slower periods during inclement weather, can lead to inconsistent cycle time measurements if not properly normalized or segmented, making accurate trending difficult. Importantly, rapidly pushing cars through without maintaining quality could lead to lower customer satisfaction, defeating the purpose.
Industry Benchmarks
Industry standards for service cycle time in car wash services typically range between 8 to 10 minutes per wash, though this can vary considerably based on the type of equipment and the complexity of the service mix offered. For efficient operations, an ideal wash should realistically aim to take between 6 and 10 minutes to optimize both service quality and profitability. Tunnel washes are generally faster due to their automated conveyor systems. These benchmarks are crucial for internal performance comparison, evaluating efficiency against competitors, and ensuring the car wash’s operational effectiveness in meeting customer expectations.
How To Improve
Strategies for improving Service Cycle Time are diverse and impactful. A foundational step is to conduct regular and proactive equipment maintenance to prevent unexpected breakdowns and ensure all machinery (conveyors, applicators, dryers) operates at peak efficiency. Second, enhance staff training programs designed to increase both the speed and accuracy of their tasks during the service process, particularly for areas involving manual pre-wash or finishing touches. Third, implement intelligent scheduling adjustments based on historical peak times and cycle data to optimally staff and prepare for anticipated demand. Finally, considering traffic flow design around the facility to reduce queue times can also significantly impact overall service delivery speed.
How To Calculate
To calculate Service Cycle Time, divide the total operational time (in minutes or hours) by the total number of completed car wash services within that period:
Service Cycle Time=Total Operational Time (minutes)÷ Number of Completed Car Wash ServicesExample of Calculation
Suppose the M-WS100 touchless car wash machine operates for a total of 480 minutes (an 8-hour shift) and manages to complete 80 washes within that time. The Service Cycle Time would be calculated as:
480 minutes÷80 washes=6 minutes per washThis metric not only underpins robust pricing strategies and effective car wash cost management but also significantly boosts customer retention by consistently ensuring prompt and efficient service delivery.
Tips and Tricks
-
Utilize automated tracking systems (often integrated with POS) to regularly monitor cycle times, ensuring consistent and objective data collection.
-
Strategically adjust staffing levels and optimize workflow during peak hours to enhance car wash efficiency and prevent bottlenecks.
-
Continuously benchmark against industry standards (e.g., the 6-10 minute ideal range) to ensure your performance remains competitive and to identify opportunities for process optimization.
-
Integrate customer satisfaction metrics and direct feedback into your cycle time analysis for continuous process improvement. Understand if increased speed is impacting perceived quality.
KPI 4: Customer Retention Rate
Definition
Customer Retention Rate (CRR) measures the percentage of repeat customers a car wash service successfully maintains over a defined period. This KPI serves as a crucial barometer for assessing how effectively a business like M-WS100 cultivates lasting relationships with its clientele. More than just a number, it is pivotal in evaluating both inherent customer satisfaction and the depth of customer loyalty, reflecting the cumulative impact of service quality, competitive pricing, the overall customer experience, and the efficacy of any loyalty initiatives.
Advantages
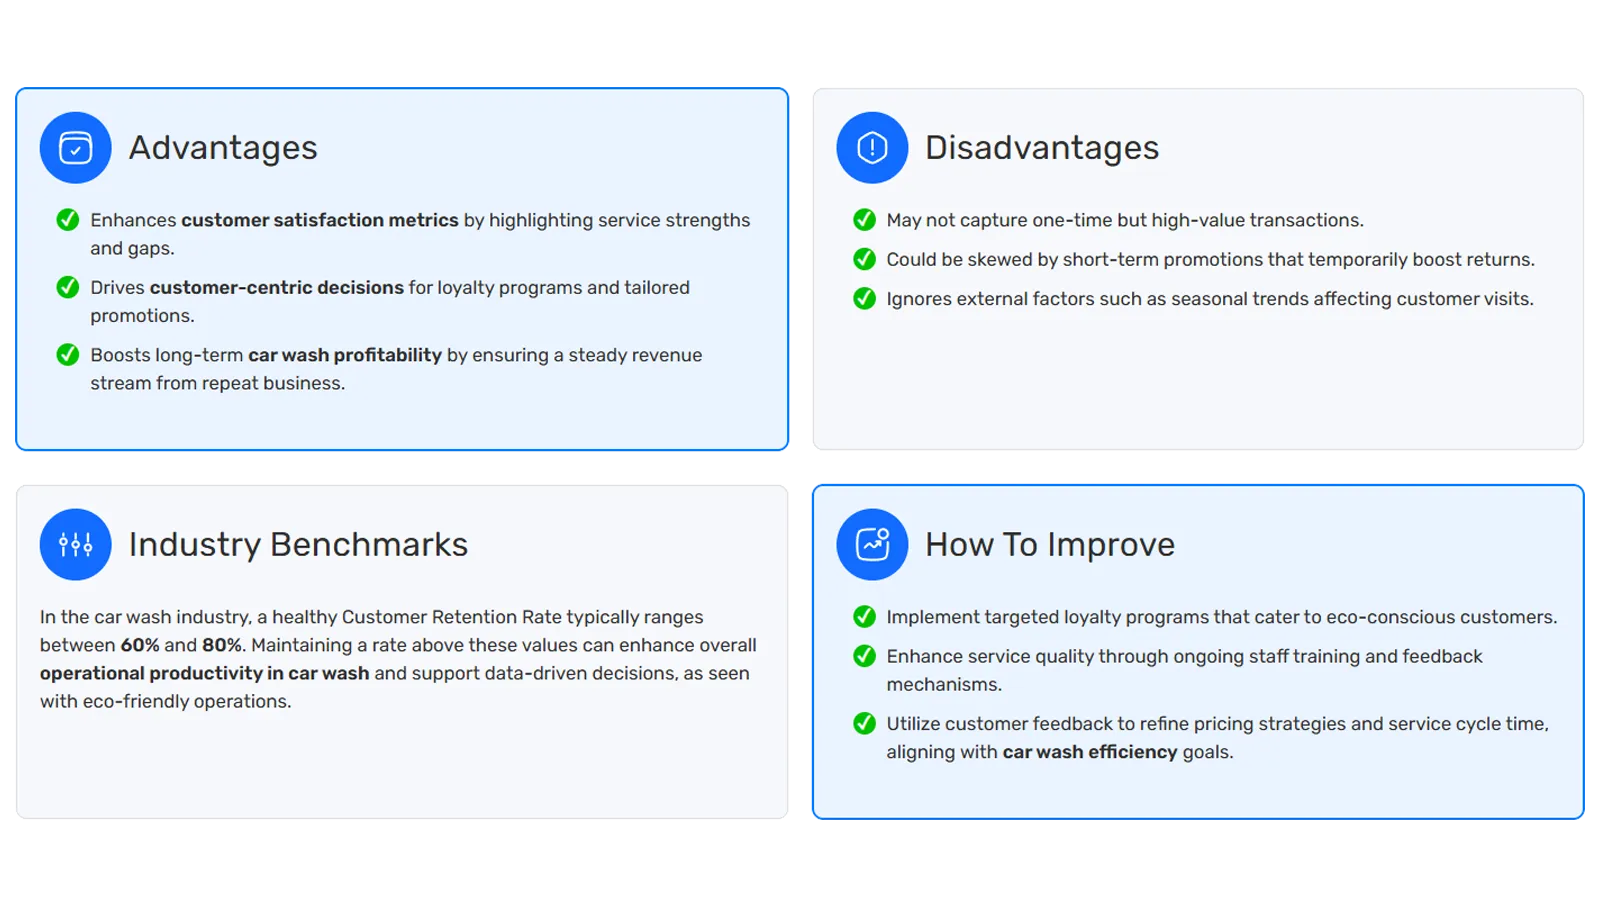
A high CRR offers numerous benefits to a car wash business. Firstly, it directly enhances customer satisfaction metrics by providing clear evidence of service strengths and areas where your operation consistently meets or exceeds customer expectations. Secondly, strong retention drives customer-centric decisions for loyalty programs and tailored promotions, as you gain deeper insights into what keeps your existing customers engaged and returning. Crafting offerings that resonate with this segment is highly effective. Most importantly, a robust CRR significantly boosts long-term car wash profitability by ensuring a steady and predictable revenue stream from repeat business, which is far more cost-effective than constantly acquiring new customers. Loyal customers also tend to spend more over their lifetime and often become organic brand advocates through word-of-mouth referrals.
Disadvantages
Despite its strategic importance, relying solely on CRR can have limitations. It may not adequately capture the full value of one-time, but exceptionally high-value transactions, which, while infrequent, can contribute significantly to revenue in niche segments (e.g., rare luxury vehicle detailing). Additionally, CRR figures could potentially be skewed by short-term promotions or aggressive discount campaigns that temporarily inflate repeat visits, creating an artificial sense of loyalty rather than genuine engagement. Furthermore, CRR often ignores external factors such as pervasive seasonal trends, inclement weather, or local events that inevitably affect customer visits and can complicate trend analysis. A reported churn rate of around 7% is an industry trend to watch, potentially influenced by economic pressures.
Industry Benchmarks
In the competitive car wash industry, a healthy Customer Retention Rate typically ranges between 60% and 80% over a given period. Some sources suggest this range varies across industries, but generally remains above 70%. For specific membership models, while individual plans might average around 15 months, family plans show higher retention, lasting around 19 months. Maintaining a retention rate consistently above these industry values is a strong indicator of superior service quality, effective loyalty initiatives, and ultimately, enhanced overall operational productivity, especially prevalent in well-managed eco-friendly operations. Some aims are for churn (the inverse of retention) to be under 5% annually.
How To Improve
Boosting Customer Retention Rate requires a focused, multi-pronged approach centered on customer value. Firstly, implement targeted loyalty programs that specifically cater to your ideal customer segments, especially eco-conscious clientele if you’re an eco-friendly car wash. This might involve tiered rewards, membership benefits (e.g., unlimited washes, express lanes), or exclusive early access to new services. Secondly, continuously enhance service quality through ongoing staff training and by actively implementing robust customer feedback mechanisms. Consistent, high-quality washes and friendly service are paramount. Thirdly, utilize customer feedback to refine pricing strategies and optimize service cycle time, ensuring they align with overall car wash efficiency goals and customer expectations for value and convenience. Lastly, personalized communication (e.g., birthday offers, service reminders) can also strengthen customer bonds.
How To Calculate
To calculate Customer Retention Rate, use the following formula over a specified period:
Customer Retention Rate=[(Customers at End of Period−New Customers Acquired During Period) ÷ Customers at Start of Period]×100Example of Calculation
If the M-WS100 touchless car wash machine commenced a particular month with 200 active customers and recorded 150 returning customers from that initial group by month’s end (excluding any entirely new customers acquired during that month), the Customer Retention Rate would be calculated as:
(150÷200)×100=75%This impressive 75% retention rate signifies robust customer loyalty via M-WS100, underscoring the success of its customer engagement and service delivery strategies. This demonstrates a valuable long-term customer base.
Tips and Tricks
-
Regularly monitor customer feedback channels (surveys, online reviews, direct comments) and translate insights into tangible adjustments in service quality and offerings to ensure customers continue to return.
-
For eco-friendly car washes, incorporate environmental incentives into loyalty programs (e.g., bonus points for using sustainable products or donating to environmental causes) to strongly resonate with your target market.
-
Leverage data from other complementary KPIs like Average Revenue Per Wash to gain context around retention trends; for instance, are returning customers spending more, validating your loyalty efforts?
-
Align customer retention strategies with your overarching financial objectives to directly impact the Gross Profit Margin in Car Wash operations and strategically reduce customer acquisition costs over time.
KPI 5: Gross Profit Margin
Definition
Gross Profit Margin (GPM) for a car wash service represents the percentage of revenue remaining after subtracting the direct costs directly attributable to delivering the service, commonly referred to as the Cost of Goods Sold (COGS). For a car wash, COGS typically includes direct variable expenses such as water, chemicals, and the labor specifically involved in the washing process itself. This crucial KPI serves as a direct indicator of a business’s fundamental financial health and operational efficiency, showcasing how effectively your pricing strategy and cost management efforts allow your revenue to cover these immediate, variable operating costs. It is the first measure of true profitability before overhead.
Advantages
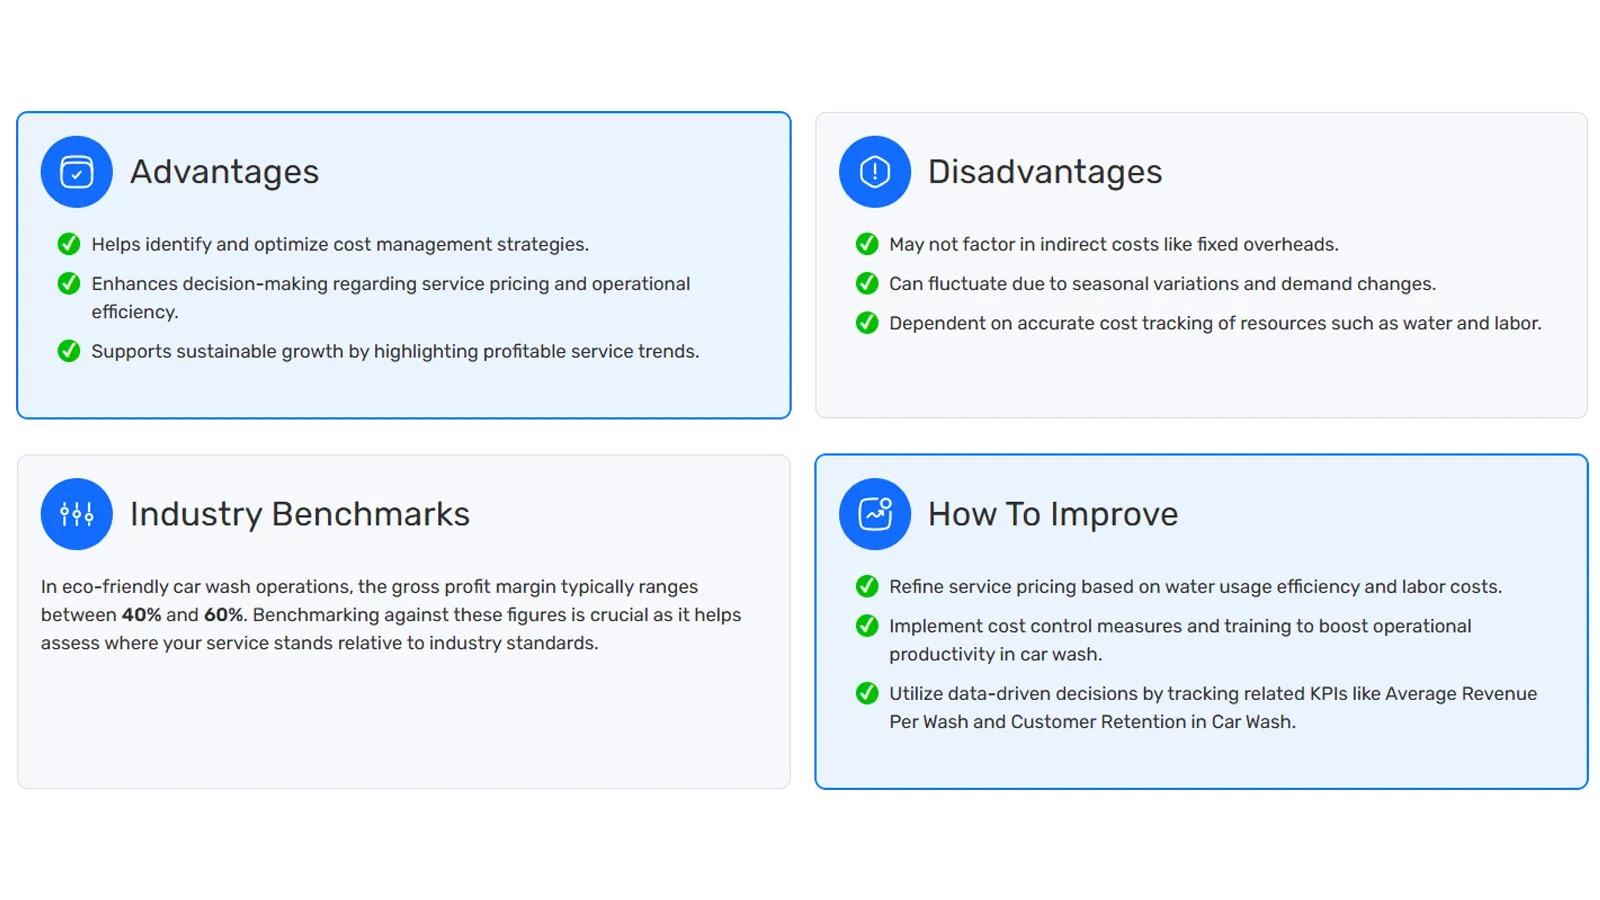
A healthy Gross Profit Margin provides several key advantages. Primarily, it helps identify and optimize cost management strategies related to your core service delivery, allowing for proactive adjustments in sourcing or process. Secondly, it significantly enhances decision-making processes regarding service pricing and internal operational efficiency; if margins are thin, you might need to raise prices or find more efficient methods. Lastly, a strong GPM supports sustainable growth by highlighting which service trends or offerings are most profitable, allowing you to allocate resources more effectively towards high-margin services. It shows if the core business model is fundamentally sound.
Disadvantages
While fundamental, Gross Profit Margin has its limitations. It may not fully factor in indirect costs or fixed overheads, such as rent, administrative salaries, insurance, or marketing expenses that are essential for running the business but not directly tied to each wash. Consequently, a high gross margin doesn’t automatically guarantee a strong net profit. GPM can also fluctuate due to seasonal variations in demand (impacting volume) and changes in resource prices, such as a spike in chemical or water costs. Furthermore, its accuracy is highly dependent on precise and accurate tracking of COGS, meaning any miscalculation in resource consumption (e.g., water, labor per car) will distort the margin.
Industry Benchmarks
Industry benchmarks for Gross Profit Margin vary across car wash types, but for eco-friendly car wash operations—like our running example—the gross profit margin typically ranges between 40% and 60%. While broader car wash industry averages can range from 35% to 60%, specific models often vary. Self-service car washes, due to lower labor costs, can achieve 50-60%. Automatic car washes might see 25-35%, while full-service, due to higher labor costs, often ranges from 20-30%. Top-tier operations, with superior pricing and efficiency, can reach 60-70%. Benchmarking against these figures is crucial for assessing your service’s competitive standing and overall operational health.
How To Improve
Improving Gross Profit Margin requires a keen focus on both revenue and direct costs. Firstly, refine service pricing strategies based on detailed analyses of water usage efficiency and direct labor costs, ensuring prices adequately cover COGS and provide a healthy margin. Secondly, implement rigorous cost control measures and comprehensive staff training programs specifically designed to boost operational productivity and minimize waste in inputs like chemicals and water. Thirdly, utilize data-driven decision-making by actively tracking related KPIs such as Average Revenue Per Wash (to boost the top line) and Customer Retention Rate (to secure consistent, predictable revenue flows for your highest-margin services). Finally, strategically evaluate supplier relationships for chemicals and utilities to secure the best possible rates without compromising quality.
How To Calculate
To calculate Gross Profit Margin, subtract the cost of goods sold (COGS) from your total revenue, then divide this result by your total revenue, and multiply by 100 to express it as a percentage:
Gross Profit Margin=(Revenue−COGS)Revenue×100Example of Calculation
For instance, if WS100 Clean Car Wash earns $2,000 in revenue and the combined costs for water and labor are $800, then:
Gross Profit Margin = [($2,000 - $800) / $2,000] x 100 = 60%This calculated 60% margin clearly indicates M-WS100’s strong control over its direct variable costs and highly efficient operational practices, positioning it well for overall profitability.
Tips and Tricks
-
Regularly monitor water usage and chemical consumption to continuously boost eco-friendly car wash efficiency and directly reduce your Cost of Goods Sold.
-
Keep a close eye on direct labor costs, especially during peak service cycle times, to ensure optimal staffing levels align with demand without leading to overspending.
-
Periodically review and adjust pricing strategies to remain competitive in the market while striving to improve Average Revenue Per Wash, especially for premium or eco-friendly services.
-
Integrate specialized KPIs such as overall car wash profitability and a detailed Gross Profit Margin analysis per service type to guide data-driven decision-making and identify your most profitable offerings.
Conclusion
In the dynamic and increasingly data-centric car wash industry, the diligent tracking and strategic application of Key Performance Indicators are no longer merely advantageous—they are fundamental to achieving and sustaining competitive advantage. From optimizing your pricing strategies with Average Revenue Per Wash, ensuring environmental and cost efficiency through Water Usage Efficiency, and enhancing customer satisfaction with a streamlined Service Cycle Time, to cultivating loyal patronage with Customer Retention Rate and guarding your financial health with Gross Profit Margin, each KPI offers a critical lens into your business’s pulse.
By integrating these five core metrics into your operational framework, car wash owners and operators can transition from reactive problem-solving to proactive, informed decision-making. Leverage modern technology, cultivate a data-aware culture within your team, and regularly benchmark your performance against industry standards to ensure your car wash not only meets current demands but also continually evolves, maximizes profitability, and secures its place as a leader in its market.
Frequently Asked Questions (FAQs)
1. Why are KPIs more effective than just looking at overall sales for a car wash?
Overall sales provide a high-level figure but lack the granularity to diagnose specific operational or market issues. KPIs dissect your performance, revealing why certain results are occurring. For example, high sales coupled with a low Average Revenue Per Wash could indicate you’re processing a large volume of low-tier washes, while high sales with low Water Usage Efficiency suggest escalating utility costs that erode profitability despite strong revenue. They illuminate underlying drivers and inefficiencies.
2. How often should a car wash business monitor its KPIs?
The monitoring frequency depends on the KPI. Operational metrics, such as Service Cycle Time and daily wash volume, should ideally be reviewed daily to quickly identify and rectify any immediate bottlenecks. Financial KPIs like Gross Profit Margin, along with customer-centric metrics such as Customer Retention Rate, are best monitored weekly, monthly, or quarterly to track trends and assess the impact of strategic initiatives. Real-time dashboards provided by modern POS systems can facilitate continuous monitoring for many operational KPIs.
3. Which single KPI is most indicative of overall financial health for a car wash?
While many KPIs contribute, the Net Profit Margin (which builds upon Gross Profit Margin by factoring in all operating expenses, interest, and taxes) is the most comprehensive single indicator of a car wash’s overall financial health. It reflects how effectively the entire business is managed, from revenue generation and operational efficiency to cost control across all departments. The provided Gross Profit Margin of 40-60% for eco-friendly operations, while excellent, only represents the core service’s profitability before fixed overheads.
4. How can technology help in tracking car wash KPIs?
Modern car wash management software and Point-of-Sale (POS) systems are invaluable for KPI tracking. They automate data collection (e.g., wash count, revenue, cycle time), perform calculations, and present insights through real-time dashboards and reports. This automation minimizes manual effort, reduces errors, and allows operators to focus on interpreting data and making strategic adjustments rather than on data compilation. These systems can also manage loyalty programs, directly impacting customer retention data.
5. Is it more important to focus on Customer Acquisition Cost (CAC) or Customer Lifetime Value (LTV)?
Neither should be focused on in isolation; their relationship is paramount. Ideally, your Customer Lifetime Value (LTV) should significantly outweigh your Customer Acquisition Cost (CAC). A commonly cited benchmark is an LTV: CAC ratio of 3:1 or higher, meaning a customer generates at least three times more revenue over their lifespan than it costs to acquire them. Prioritizing both — acquiring customers cost-effectively while maximizing their long-term value through retention and upselling — is key to sustainable profitability.
6. What are practical steps a car wash can take to improve its Gross Profit Margin?
To enhance Gross Profit Margin, focus on both revenue enhancement and direct cost reduction. Practically, you can:
-
Optimize pricing and package offerings to encourage customers toward higher-value washes (increasing Average Revenue Per Wash).
-
Implement stringent control over variable costs, particularly chemicals and water usage, through precise dosing equipment, leak detection, and water reclamation systems (improving Water Usage Efficiency).
-
Enhance staff training to ensure efficient use of supplies and optimal labor productivity during peak Service Cycle Times (reducing labor costs per wash).
-
Regularly evaluate and negotiate with suppliers for better pricing on cleaning agents and utilities.
-
Minimize waste and ensure equipment is operating efficiently to prevent unnecessary resource consumption.