


Every piece of car wash equipment has a lifecycle. A touchless in-bay automatic might run 10 to 15 years. A friction rollover can last 10 to 20 years. A conveyor system may operate for 25 years or more. But “last” doesn’t mean “should still be operating.” It means the estimated operational period before replacement becomes economically rational — and that threshold is reached far earlier than most operators expect.
The problem is that equipment end-of-life is rarely a single dramatic failure. It’s a gradual accumulation of rising maintenance costs, declining wash quality, increasing downtime, and shrinking parts availability. By the time an operator recognizes the problem, the deferred costs have already eroded profitability for months — sometimes years. This article provides a data-driven framework for identifying when equipment has genuinely reached end of life, with specific benchmarks by equipment type, ROI calculations for upgrade decisions, and guidance tailored to gas stations, fleet operators, car dealers, and multi-site investors.
What “End of Life” Really Means: Three Types of Obsolescence
Equipment doesn’t die — it obsolesces. Understanding the three forms of obsolescence is the foundation for making rational replacement decisions rather than emotional ones.
1. Physical Deterioration
This is the most visible form: worn brushes, corroded frames, failing pumps, degraded nozzles. Physical deterioration is accelerated by hard water, harsh chemicals, heavy usage cycles, and inadequate maintenance. Industry data shows that high-use machines exceeding 350,000 wash cycles begin showing measurable signs of component fatigue, regardless of age. In harsh environments — cold winters with road salt, coastal salt air, hard water regions — this threshold arrives 20–30% sooner.
The key metric here is maintenance cost per car. When this figure begins trending upward year over year despite consistent maintenance practices, physical deterioration is advancing past the point of diminishing returns.
2. Functional Obsolescence
Functional obsolescence occurs when equipment still works but lacks features that current market standards demand. A nine-year-old control system may be fully operational, but if it can’t integrate with mobile payment, membership programs, or license-plate recognition, it’s functionally obsolete. The equipment cleans cars, but the business loses customers to competitors offering modern conveniences.
Functional obsolescence is the most insidious form because it doesn’t trigger alarm bells. The wash runs. Revenue doesn’t collapse — it gradually erodes as newer competitors enter the market. Operators often don’t recognize the impact until a new wash opens within their trade area and car counts drop 15–25% over the following six months.
3. External Obsolescence
External obsolescence is caused by factors entirely outside the operator’s control: the manufacturer discontinues a product line, replacement parts become unavailable, or software platforms lose support. The PDQ LaserWash 4000 was retired in 2007, yet some operators continued running units for years afterward — paying premium prices for scavenged parts and accepting extended downtime when specific components couldn’t be sourced at all.
External obsolescence follows a predictable three-phase parts pipeline:
| Phase | Parts Availability | Cost Impact | Typical Duration |
|---|---|---|---|
| Surplus | OEM and aftermarket parts still in stock | Normal pricing | 2–5 years post-discontinuation |
| Remanufactured-only | New parts no longer manufactured; rebuilders serve wear items | 20–50% premium | 3–7 years |
| Obsolete | Parts virtually unobtainable; custom fabrication required | 5x–10x original cost; extended downtime | Indefinite |
Equipment Lifespan Benchmarks by Type
Different equipment types have fundamentally different lifecycle profiles. The table below reflects 2026 industry data, combining manufacturer specifications with real-world operator feedback:
| Equipment Type | Typical Lifespan | Maintenance Burden | Common End-of-Life Trigger |
|---|---|---|---|
| Touchless in-bay automatic | 10–15 years | Low–Moderate | Pump failure, nozzle degradation, software incompatibility |
| Friction rollover / gantry | 10–20 years | Moderate | Brush material degradation, frame corrosion, motor failure |
| Tunnel conveyor system | 15–25+ years | High | Chain wear, conveyor fatigue, control system obsolescence |
| Self-service bay equipment | 8–15 years | Low | Pump failure, coin/token mechanism obsolescence, bay deterioration |
| Truck / commercial wash | 12–20 years | Moderate–High | Heavy-contaminant wear, structural corrosion, pump degradation |
| Water treatment / reclaim | 7–12 years | Low (but most neglected) | Filter media exhaustion, valve failure, regulatory non-compliance |
These ranges assume reasonable maintenance. Equipment that receives no preventive care will reach end-of-life 30–50% sooner. Conversely, well-maintained equipment with documented service records can exceed the upper bounds — but extending lifespan through maintenance has diminishing returns once annual repair costs exceed 15% of replacement cost.
Six Warning Signs That Equipment Has Reached End of Life
Rather than relying on age alone, operators should monitor these six indicators. Any single sign warrants investigation; two or more simultaneously indicate that replacement planning should begin immediately.
Sign 1: Maintenance Costs Crossing the Threshold
Industry benchmark: if annual maintenance and repair costs exceed $20,000 for a single in-bay automatic, or if the site experiences more than one full day of downtime per quarter, the equipment has crossed the economic replacement threshold. At this point, continued repair is destroying value — each dollar spent on patches is a dollar not invested in equipment that would generate higher revenue and lower operating costs.
For tunnel systems, the threshold is higher in absolute terms but the principle holds: when maintenance costs per car begin trending upward year-over-year despite consistent practices, the equipment is in physical decline. Track this metric monthly, not annually — quarterly reviews can mask accelerating deterioration.

Sign 2: Declining Wash Quality Despite Calibration
If wash quality complaints increase despite proper chemical calibration, correct water pressure settings, and functional nozzles, the root cause is often mechanical wear that calibration cannot compensate for. Worn brush material loses its cleaning effectiveness. Degraded high-pressure pumps deliver inconsistent spray patterns. Aging conveyor systems introduce vibration that disrupts wash timing.
Customer perception matters more than technical metrics. If Google reviews begin mentioning “spots,” “streaks,” or “not as clean as it used to be,” the equipment’s output quality has declined below the market’s expectations — regardless of what the spec sheet says.
Sign 3: Rising Downtime Frequency
The industry average for unplanned downtime is approximately 15 hours per year for a well-maintained site. Premium operators achieve fewer than 3 hours. If your site’s unplanned downtime is increasing — particularly if the same components fail repeatedly — the equipment is telling you it’s tired.
Each day of tunnel downtime costs $5,000–$15,000 in lost revenue. Each day of in-bay downtime costs $500–$2,000. When you calculate the cumulative annual cost of downtime and add it to repair expenses, the total often exceeds the financing cost of new equipment.
Sign 4: Parts Availability Deteriorating
If your equipment supplier begins quoting longer lead times for common wear parts, or if they suggest “remanufactured” or “aftermarket” alternatives for components that were previously available as new OEM stock, the product line is entering the obsolescence pipeline. This is the earliest external signal that proactive replacement planning should begin.
Lead times for custom-fabricated tunnel sections have extended to 14–20 weeks in 2026, compared to 8–12 weeks in 2019. If you wait until a critical component fails to order its replacement, you may face months of downtime — not days.
Sign 5: Technology Gap With Competitors
When a new wash opens within your trade area and offers features your equipment cannot match — mobile payment, license-plate recognition, membership integration, dynamic pricing, app-based scheduling — your site is at a competitive disadvantage that will manifest as declining car counts within 6–12 months.
The technology gap is particularly acute in payment systems. A modern car wash POS system with LPR, touchscreen interface, and membership management costs $10,000–$30,000 but typically achieves ROI in 12–24 months through faster transactions, automated upselling, and recurring membership revenue. Sites still operating cash-only or basic credit card kiosks are leaving significant revenue on the table.
Sign 6: Revenue Decline Without External Cause
If revenue declines by more than 10% year-over-year and you cannot attribute it to weather, road construction, or a new competitor, the most likely cause is customer perception of declining service quality. This is the lagging indicator — by the time it appears, the equipment’s obsolescence has already cost you customers who may not return even after an upgrade.
The Repair-vs-Replace Decision Matrix
Not every end-of-life signal requires full equipment replacement. The right response depends on the equipment’s age, the nature of the obsolescence, and the site’s strategic role. Use this framework to categorize the appropriate response:
| Scenario | Recommended Action | Typical Investment | Expected Payback |
|---|---|---|---|
| Equipment < 7 years old, isolated component failure | Repair with OEM parts | $2K–$15K | Immediate (downtime avoidance) |
| Equipment 7–10 years, maintenance costs rising but controlled | Partial upgrade (POS, payment, chemical system) | $10K–$50K | 12–24 months |
| Equipment 10–15 years, multiple signs present | Full equipment replacement | $100K–$300K (in-bay); $300K–$600K (tunnel) | 7–18 months (in-bay); 1–3 years (tunnel) |
| Equipment 15+ years, no maintenance records | Immediate replacement — do not attempt repair | Full replacement cost | Calculated on new equipment ROI |
| OEM discontinued product line | Proactive replacement within 2–3 years | Full replacement cost | Avoids $20K+ emergency repairs and extended downtime |
Partial Upgrades: When They Make Sense
Not every upgrade requires full equipment replacement. Partial upgrades can extend the useful life of aging equipment by 3–5 years while delivering meaningful ROI:
- Payment system upgrade: Replace legacy kiosk with modern POS ($10K–$30K). ROI: 12–24 months through faster throughput, upselling, and membership sales.
- Chemical system optimization: Switch from dilute to concentrated chemicals with precision dosing ($5K–$15K). ROI: 6–12 months through 15–25% chemical cost reduction.
- Drying system upgrade: Replace aging blowers with high-velocity modern units ($8K–$25K). ROI: 6–18 months through reduced hand-drying labor and improved customer satisfaction.
- Water reclaim retrofit: Add or upgrade water treatment and recycling systems ($50K–$150K). ROI: 18–36 months through reduced water bills and regulatory compliance.
Full Replacement: When It’s the Only Rational Choice
Full replacement becomes the only rational choice when:
- Annual maintenance costs exceed 15% of new equipment cost
- The OEM has discontinued the product line and parts are in the remanufactured-only phase
- The equipment cannot support modern payment, membership, or vehicle-recognition technology
- Wash quality cannot be restored to market-standard levels through calibration and component replacement
- The equipment is 15+ years old with no documented maintenance history
ROI Calculation: Building the Business Case
Once the decision to upgrade is made, the business case must be built on verified numbers — not manufacturer promises. Here’s a practical framework:
Step 1: Quantify the Cost of Inaction
Before calculating upgrade ROI, calculate what inaction costs. Add up:
- Annual maintenance and repair costs (trending upward)
- Annual downtime cost (days × daily revenue)
- Estimated revenue loss from declining wash quality (customer churn × average annual spend)
- Estimated revenue loss from technology gap (customers lost to competitors with modern features)
This total often exceeds $50,000–$100,000 annually for a struggling site — money that is being spent anyway, just not on equipment that improves the business.
Step 2: Calculate Upgrade ROI
For a touchless in-bay automatic replacement, a conservative ROI model:
| Parameter | Conservative Estimate | Optimistic Estimate |
|---|---|---|
| Initial investment (equipment + installation) | $175,000 | $175,000 |
| Average wash price | $14 | $16 |
| Daily car volume | 45 | 60 |
| Monthly revenue | $18,900 | $28,800 |
| Monthly OpEx (chemicals, utilities, maintenance) | $4,500 | $6,000 |
| Monthly labor | $2,000 | $2,000 |
| Net profit per month | $12,400 | $20,800 |
| Simple payback period | ~14 months | ~8.5 months |
For larger investments like tunnel systems, the payback period extends to 1–3 years due to higher capital costs ($300K–$600K for equipment alone), but the absolute revenue and profit potential are substantially higher. A comprehensive cost guide covering all equipment types — including specific product pricing — can help operators build accurate pro forma models.
Step 3: Factor in Hidden Costs and Benefits
ROI calculations often miss costs and benefits that don’t appear on the equipment quote:
| Hidden Costs | Hidden Benefits |
|---|---|
| Shipping and installation ($10K–$30K) | Insurance premium reduction (15–30% for touchless systems) |
| Site preparation (electrical, plumbing, concrete) | Damage claim elimination (touchless eliminates brush-contact claims) |
| Downtime during installation (1–5 days) | Chemical cost reduction (15–25% with precision dosing) |
| Staff training on new system | Energy cost reduction (modern motors and dryers) |
| Software licensing and integration | Membership revenue enablement (modern POS supports unlimited wash clubs) |
| Permit modifications | Valuation premium (modern equipment + documented maintenance = higher EBITDA multiple) |
By Equipment Type: What to Watch For
Touchless Systems
A touchless car wash system has the lowest maintenance burden among automatic wash types, but its end-of-life indicators are specific: high-pressure pump degradation (measured by declining PSI output), nozzle wear (inconsistent spray patterns), and software obsolescence (inability to support modern vehicle shapes and sensor configurations). If your touchless system can’t accommodate electric vehicles or large SUVs without manual intervention, it’s functionally obsolete regardless of age.
Gantry / Rollover Systems
A gantry car wash system typically has a longer mechanical lifespan than touchless but is more susceptible to brush material degradation. Watch for: decreased cleaning effectiveness on lower vehicle panels, brush replacement frequency increasing beyond annual cycles, and frame corrosion (particularly in cold-climate regions with road salt). If the frame shows structural corrosion, replacement — not repair — is the only safe option.
Tunnel Systems
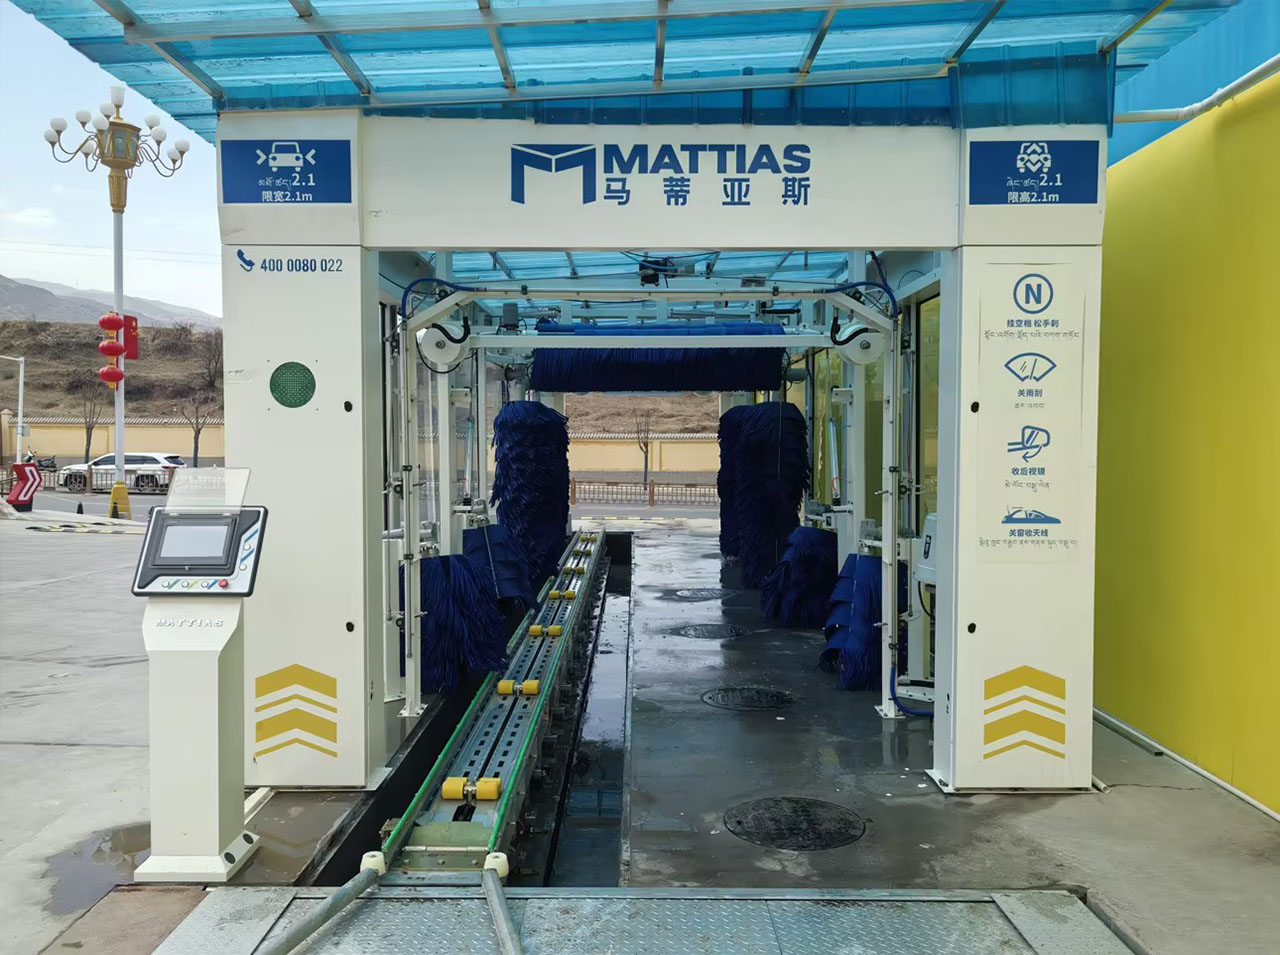
A tunnel car wash system has the highest maintenance burden and the most complex end-of-life assessment. Key indicators: conveyor chain elongation beyond manufacturer tolerance, mitter cloth and brush degradation affecting wash quality across multiple vehicle sections, blower motor bearing failure (measured by vibration analysis), and control system obsolescence (legacy PLC unable to integrate with modern POS or membership platforms). Partial upgrades — replacing specific components while retaining the tunnel structure — can extend life by 5–8 years if the conveyor and frame are structurally sound.
Self-Service Bays
Self-service equipment has the lowest replacement cost but the highest functional obsolescence risk. If the bays still use coin mechanisms without card or mobile payment, they’re losing 30–40% of potential revenue from customers who carry no cash. The ROI on upgrading payment systems alone is typically under 12 months.
Truck and Commercial Wash
Truck wash systems and commercial vehicle wash equipment face accelerated physical deterioration due to heavy contaminants — mud, grease, road salt, and chemical residues. Monitor pump seal integrity, structural corrosion on contact areas, and water reclaim system effectiveness. These systems have the highest cost of downtime because fleet schedules can’t accommodate wash unavailability.
By Buyer Type: What Matters Most
Gas Stations and Convenience Stores
Gas station operators typically run single in-bay automatics or self-service bays with lower volume than dedicated wash sites. The end-of-life decision here is simpler because the equipment represents a smaller capital investment. Key guidance:
- If the in-bay automatic is 10+ years old and the manufacturer has discontinued the model, begin replacement planning now — don’t wait for the failure that forces an emergency purchase at premium pricing
- A touchless system is particularly valuable for gas station sites serving diverse vehicle types including electric vehicles, which have specific washing requirements
- Payment system upgrades deliver the fastest ROI for gas station washes — customers expect to pay the same way they pay for fuel
- Water reclaim upgrades may be mandatory if local regulations tighten — budget proactively rather than waiting for compliance orders
Fleet Operators
Fleet operators face a different calculation: the equipment’s end-of-life is measured not in revenue lost but in compliance risk and operational disruption. Key guidance:
- If fleet wash downtime is causing vehicles to miss inspection schedules or delivery windows, the equipment has reached functional end-of-life regardless of mechanical condition
- Water reclaim system effectiveness is critical — trucks carry heavier contaminants that accelerate filter media exhaustion and valve wear
- Replacement planning should align with fleet expansion timelines — if you’re adding 20% more vehicles, your wash capacity needs to scale accordingly
- Calculate ROI on external wash cost elimination: if you’re spending $4,000+/month outsourcing fleet washing, a $150K system pays back in under 3 years
Car Dealers and Distributors
Dealers have the lowest tolerance for wash quality issues — a single scratch on a new vehicle can cost thousands in reconditioning or customer goodwill. Key guidance:
- Any equipment that has caused a customer vehicle damage claim should be evaluated for replacement immediately — the risk of recurrence is a liability, not a maintenance issue
- Touchless systems are the preferred replacement for dealer prep centers because they eliminate brush-contact risk entirely
- Equipment that cannot accommodate the dimensions or sensor configurations of current model-year vehicles is functionally obsolete — EVs, large SUVs, and low-clearance sports cars all require updated wash programs
- Replacement timing should align with dealership renovation cycles to minimize disruption
Investors and Multi-Site Operators
For investors, equipment end-of-life is a valuation issue, not just an operational one. Key guidance:
- Sites with equipment 12+ years old will face buyer scrutiny during due diligence — the equipment assessment ($2K–$5K) will identify deferred capital requirements that reduce the purchase price
- Modern equipment with documented maintenance records supports higher EBITDA multiples — the difference between a 5x and 7x multiple on $500K EBITDA is $1M in transaction value
- When acquiring a portfolio, prioritize sites where equipment replacement has already been completed — you’re buying stabilized cash flow, not a capital project
- For sites requiring equipment replacement post-acquisition, explore options from established manufacturers with 20+ years of industry experience who can provide both equipment and ongoing service support across multiple locations
Planning the Upgrade Timeline
Once the decision to upgrade is made, the timeline matters as much as the equipment choice. Rushing leads to poor decisions; delaying leads to emergency replacements at premium pricing. A rational timeline:
| Phase | Duration | Key Activities |
|---|---|---|
| Assessment and specification | 1–2 months | Professional equipment audit, site assessment, equipment selection, budget finalization |
| Procurement and financing | 2–4 months | Equipment ordering (14–20 week lead times for custom tunnel components), financing arrangement, permit applications |
| Installation and commissioning | 1–4 weeks | Equipment removal, site preparation, installation, testing, staff training |
| Optimization and ramp-up | 1–3 months | Chemical calibration, wash quality optimization, marketing launch, membership migration |
Total timeline from decision to stabilized operation: 4–9 months for in-bay systems, 6–12 months for tunnel systems. Plan accordingly — don’t wait until the equipment fails to begin this process.
For reference on successful equipment replacement projects, review completed installations across different site types and equipment configurations. Real-world examples provide more actionable benchmarks than manufacturer specifications alone.
Conclusion: End of Life Is a Decision, Not an Event
Equipment end-of-life is not a single moment of failure — it’s a gradual process that can be anticipated, planned for, and managed. The operators who wait for catastrophic failure are the ones who pay premium prices for emergency replacements, lose weeks of revenue during unplanned downtime, and lose customers to competitors who planned ahead.
The framework is straightforward:
- Monitor the six warning signs — maintenance costs, wash quality, downtime, parts availability, technology gap, and revenue trends
- Use the repair-vs-replace matrix — match the response to the equipment’s age, condition, and obsolescence type
- Build the business case on verified numbers — include hidden costs, hidden benefits, and the cost of inaction
- Plan the timeline proactively — 4–9 months for in-bay, 6–12 months for tunnel, starting from the decision date
- Replace when two or more signs are present — don’t wait for the third
For gas stations, fleet operators, and car dealers, the decision is often simpler because the use case is narrower and the equipment represents a smaller portion of total business value. For investors and multi-site operators, the decision has valuation implications that extend far beyond the equipment itself — modern, well-maintained equipment with documented service records is a prerequisite for premium EBITDA multiples.
The most expensive equipment decision is not buying new equipment too early. It’s buying new equipment too late — after the maintenance costs, downtime losses, and customer churn have already consumed the capital that could have funded the upgrade.