

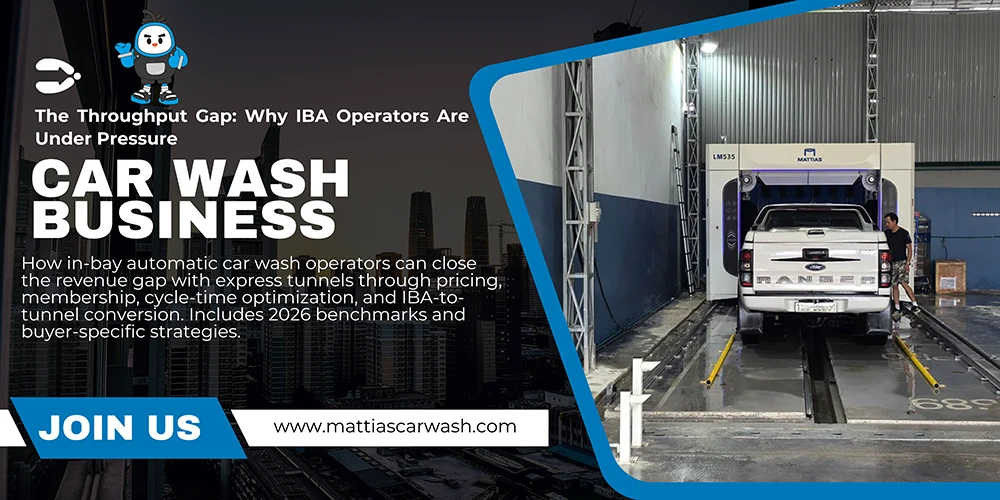

An in-bay automatic (IBA) car wash typically processes 8 to 12 vehicles per hour. A properly loaded express tunnel handles 80 to 120. That is not a marginal difference — it is a 10x throughput advantage that translates directly into revenue, market share, and membership growth.
The pressure is intensifying. The International Carwash Association’s Q4 2025 Pulse report projects slower revenue growth in 2026 as subscription enrollment flattens and competition from new express tunnel builds continues. For IBA operators — particularly those at gas stations, convenience stores, and standalone investor sites — this means the time for incremental improvements has largely passed. The operators who thrive in 2026 are those who extract maximum revenue from every bay, every cycle, and every customer interaction.
Consider the pricing reality. A typical express tunnel menu ranges from $10 to $25 per wash. The closest in-bay automatic charges $7 to $15. That is a $3 to $10 per-car premium for what is fundamentally the same clean, shine, and protect service — with the main differentiators being tire shine and ceramic coating options that an IBA can also offer.
The question is not whether IBA operators can compete. They can. The question is whether they are willing to act on the specific levers that close the gap — before a tunnel operator opens across the street and takes 40% of their customer base in less than a month.
Understanding the Revenue Per Car Equation
Before diving into strategies, it is worth understanding why the gap exists and where the money actually goes. Bob Roman, a car wash consultant with decades of IBA experience, identified a $5.41 per-car throughput gap between express tunnels and in-bay automatics — not because the IBA cleans worse, but because express tunnels sell more high-value add-on products per wash.
Here is how the benchmarks stack up in 2026:
| Metric | Investor-Site IBA | Gas-Site IBA | Express Tunnel |
|---|---|---|---|
| Annual washes (benchmark) | 10,560 | 17,600 | 60,000–120,000+ |
| Average revenue per car | $7.50 | $9.00 | $12–$18 |
| Expense ratio (% of revenue) | 50% | 44% | 35–42% |
| Cars per hour (capacity) | 8–12 | 8–12 | 80–120 |
| Wash cycle time | 2.5–6.5 min | 2.5–6.5 min | 3–5 min (continuous) |
| Staffing requirement | None (24/7 capable) | None (24/7 capable) | 2–4 attendants |
| Annual revenue range | $80K–$170K | $120K–$250K | $700K–$2M+ |
Sources: Auto Laundry News operator surveys, IBISWorld industry data, ICA Q4 2025 Pulse report, and operator-reported figures from industry forums (2024–2026).
The table reveals a paradox: the IBA’s structural advantages — no staffing, 24/7 operation, lower capital investment — are real, but they are overwhelmed by the tunnel’s volume capacity. An IBA cannot out-wash a tunnel. But it can out-earn a tunnel on a per-car basis if the operator optimizes the right levers.
Top-performing IBA operators in semi-rural markets achieve average revenue exceeding $16 per car, with the top two wash packages accounting for roughly 80% of sales. The Auto Laundry News 2023 survey reported an industry average of just $10.19. The gap between average and top performers is where the opportunity lives.
Strategy 1: Value-Added Product Expansion
The fastest revenue lever available to an IBA operator is adding products that express tunnels already offer. Roman’s analysis showed that adding tire shine and ceramic coating to an IBA product line — with a $0.67 increase in variable cost and a $2.00 increase in average per-car revenue — produces a $1.33 per-car increase in contribution margin. At 20,000 cars per year, that is $26,600 going straight to the bottom line.
| Value-Added Product | Variable Cost Add | Price Add | Margin Contribution |
|---|---|---|---|
| Tire shine | $0.15–$0.25 | $2.00–$3.00 | $1.75–$2.85 |
| Ceramic / clear coat sealant | $0.30–$0.50 | $3.00–$5.00 | $2.50–$4.70 |
| Triple-foam conditioner | $0.10–$0.20 | $1.00–$2.00 | $0.80–$1.90 |
| Undercarriage wash | $0.05–$0.10 | $1.00–$2.00 | $0.90–$1.95 |
| Wheel/blower detail (air drying) | $0.02–$0.05 (electricity) | $1.00–$1.50 | $0.95–$1.48 |
The critical insight: chemical cost per car should be tracked to the penny. A typical range is $0.50 to $1.50 per car depending on the package. Operators who do not know their exact per-car chemical cost are flying blind on pricing decisions. Precision dosing systems — modern metering pumps that dose to fractions of a milliliter — can extend chemical drum life to approximately 3,000 washes per 20 kg drum, simultaneously reducing waste and improving consistency.
For operators evaluating touchless in-bay systems, the good news is that high-pressure touchless equipment can apply all of these value-added products without additional brush contact, preserving the paint-safe proposition that attracts premium customers.
Strategy 2: Pricing Optimization Without Losing Volume
Many IBA operators underprice out of fear — fear that raising prices will drive customers to the competition. The data suggests the opposite: underpricing signals low quality, and customers who are price-sensitive enough to leave for a $1 difference are not the customers who drive sustainable revenue.
The key is understanding the price elasticity of your specific market. Here is a practical framework:
| Pricing Scenario | Current Avg/Car | Optimized Avg/Car | Volume Impact | Net Revenue Change |
|---|---|---|---|---|
| Add top-tier package (ceramic + tire shine) | $10 | $12.50 | +0 to −5% | +19% to +25% |
| Raise all tiers by $1 | $10 | $11 | −3% to −8% | +2% to +7% |
| Restructure tiers (Bronze→Platinum) | $10 | $13 | −5% to −10% | +17% to +22% |
| Dynamic peak pricing (+15% Sat peak) | $10 | $10.50 blended | −2% to −5% (deflected) | +3% to +8% |
The operators who achieve $16+ per car do not get there by charging more for the same wash. They get there by restructuring the menu so that the top two tiers — which carry the highest margin — account for the majority of sales. This requires the tier spacing strategy discussed below under membership pricing.
Strategy 3: Membership Programs — The IBA’s Defense Against Tunnels
This is the single most important strategy for IBA operators in 2026. When a tunnel operator opens nearby and launches an “unlimited washes for $29.99/month” campaign, an IBA without a membership offering has no direct response. The customer sees a compelling recurring-value proposition at the tunnel and nothing comparable at the IBA.
The good news: IBA membership programs work, and they work well — if structured correctly. Industry practitioners consistently agree on a core formula:
Here is how a well-structured tier system looks for a typical dual-bay IBA:
| Plan | Single Wash Price | Monthly Membership | Multiplier |
|---|---|---|---|
| Bronze (basic wash) | $10 | $24.99 | 2.5x |
| Silver (basic + foam) | $12 | $29.99 | 2.5x |
| Gold (premium + tire shine) | $14 | $36.99 | 2.6x |
| Platinum (all + ceramic) | $16–$18 | $39.99 | 2.2–2.5x |
Note that the top two tiers are only $3 apart in monthly cost — this is deliberate. When the jump from mid-tier to top-tier is too large (e.g., $30 to $40), most members pile into the mid-tier and the top-tier barely sells. Narrow spacing at the top nudges members upward.
For a comprehensive breakdown of membership tier design, plan limits, and competitive positioning against tunnel washes — including real operator case studies — see the detailed IBA membership pricing strategy guide that covers tier spacing psychology, break-even calculations, and the specific tactics top IBA operators use to hold customers when a tunnel opens nearby.
Strategy 4: Payment Friction Reduction
Every second a customer spends at a payment kiosk is a second of throughput lost. For IBAs, which rely on self-service payment, the kiosk is often the single largest bottleneck — not the wash equipment itself.
Specific friction points and their solutions:
| Friction Point | Time Lost | Solution |
|---|---|---|
| Complex menu navigation | 30–60 sec | Simplify to 3–4 tiers max; use large buttons and clear icons |
| Cash payment (bills/coins) | 45–90 sec | Promote card/mobile payment; keep cash option but streamline |
| License plate recognition (LPR) entry | 0 sec (automated) | Install LPR for members — gate opens, no stop required |
| Pay-at-pump integration (gas sites) | 0 sec (pre-paid) | Integrate wash purchase into fuel pump POS; customer enters code at bay |
| Mobile app / QR code payment | 10–15 sec | App-based payment with QR scan at bay entrance |
For gas-station operators, pay-at-pump integration is the single highest-ROI payment upgrade. When a customer can add a wash to their fuel purchase with one button press at the pump — and then simply drive into the bay and enter a code — the friction drops to near zero. Operators report 20-30% increases in wash attachment rates after implementing seamless pump-to-bay payment flows.
The underlying technology — the PLC-controlled entry systems used in modern in-bay equipment — supports these integrations natively. The question is whether the operator has invested in the software bridge between the fuel pump POS and the wash bay controller.
Strategy 5: Digital Presence and Customer Acquisition
Roman’s original recommendation to “create a digital presence” was sound in 2024. In 2026, it is a survival requirement. Customers find car washes the same way they find restaurants — on their phone, via Google Maps, reading reviews.
The minimum viable digital presence for an IBA in 2026:
- Google Business Profile — claimed, updated hours, photos of the bay and equipment, respond to every review within 48 hours. This is the single most important digital asset for a location-based business.
- Website or landing page — even a single page with location, hours, pricing, and membership sign-up. A website with pricing transparency builds trust; a wash with no online presence looks abandoned.
- Social media (at minimum Facebook/Instagram) — post wash photos, seasonal promotions, before/after content. Consistent posting signals an active, maintained business.
- Online review management — actively request reviews from satisfied customers. A wash with 200+ reviews at 4.5 stars will outcompete one with 12 reviews at 4.8 stars in local search rankings.
- Membership digital enrollment — customers should be able to sign up for a membership online or via app without visiting the site or calling anyone.
Strategy 6: Amenities That Match Express Competitors
Express tunnels offer free vacuums, mat cleaners, towel dispensers, and sometimes air freshener stations. When a customer pulls into an IBA and sees none of these, the perceived value gap widens — even if the wash quality is identical.
Key amenities and their investment/return profile:
| Amenity | Investment | Revenue Impact | Notes |
|---|---|---|---|
| Free vacuums (2–4 units) | $3K–$8K | +10–20% revenue | Customer expectation; absence is a red flag |
| Microfiber towel vending | $500–$1.5K | $1–$2/sale (high margin) | Impulse purchase; pairs with vacuum use |
| Air freshener / fragrance vending | $300–$800 | $2–$4/sale (very high margin) | Near-zero maintenance; passive revenue |
| Mat cleaner / mat rack | $1K–$3K | +5–10% attachment | Differentiator vs. tunnels that don’t offer it |
| Lighting / LED bay illumination | $2K–$5K | Indirect (perceived quality) | Dark bays look unsafe and unclean |
The total amenity investment — vacuums, vending, mat cleaner, lighting — typically falls in the $7,000 to $18,000 range. At a 15% revenue uplift on a site doing $150,000/year, that is $22,500 in additional annual revenue, meaning the amenity package pays for itself in 4–10 months.
Strategy 7: Cycle Time Optimization — The Hidden Throughput Lever
This is the strategy most IBA operators overlook entirely. The wash equipment itself is usually not the bottleneck — the cycle time is. An IBA that takes 6.5 minutes per premium wash can only process 9 cars per hour. If that same wash can be reduced to 4.5 minutes, throughput rises to 13 cars per hour — a 44% increase with zero capital investment in new equipment.
Key cycle-time optimization levers:
| Lever | Time Saved | Mechanism |
|---|---|---|
| Faster-acting chemistry | 0.5–1.5 min | High-quality active foam that emulsifies dirt in one pass; reduces dwell time without quality loss |
| Optimized high-pressure pump flow | 0.3–0.8 min | Higher flow rate and better nozzle coverage reduce rinse cycles needed |
| Dual-dryer configuration | 0.5–1.0 min | Two opposed dryers cut drying time by 30–50% vs. single-dryer setup |
| Drive-through bay design | 0.5–1.0 min | Eliminates back-out maneuvering; vehicle enters and exits in same direction |
| Programmable wash packages | 0.5–2.0 min | Shorter programs for basic tiers; longer programs reserved for premium — customer self-selects cycle time |
| Vehicle detection & auto-start | 0.3–0.5 min | Sensors detect vehicle position and start cycle automatically — no manual confirmation delay |
The combined effect of these optimizations can reduce a premium wash cycle from 6.5 minutes to approximately 4.0–4.5 minutes — increasing hourly capacity from 9 cars to 13–15 cars. On a site doing 17,600 washes per year, even a 1-minute reduction per wash saves 293 hours of bay time annually — equivalent to roughly 2,600 additional washes at the same utilization rate.
Modern gantry and rollover car wash systems are designed with these optimizations in mind — variable frequency drives for pump speed control, programmable wash profiles per package tier, and integrated vehicle detection. Older equipment may require retrofitting, but the payback on cycle-time improvements is typically measured in months, not years.
Strategy 8: The IBA-to-Tunnel Conversion Decision
When all optimization strategies have been exhausted and the site still cannot meet demand, the next conversation is conversion — replacing the IBA with a mini-tunnel or compact conveyor system.
A 2025 case study from Bainbridge, Georgia illustrates the potential: an IBA washing approximately 40,000 cars per year at capacity was converted to a 60-foot surface-mount mini-tunnel. Throughput jumped from roughly 20 cars per hour to 40–60 cars per hour — a 2-3x increase within the same general footprint. Another California site saw daily throughput double (100 → 200 cars/day) after converting from a rollover to a conveyor tunnel system.
But conversion is not a universal solution. Here is the decision framework:
| Factor | Convert When | Do NOT Convert When |
|---|---|---|
| Annual volume | 25,000+ washes/year at capacity | Under 15,000 washes/year |
| Market growth | Population/housing growing 5%+/year | Stable or declining population |
| Competition | Express tunnel built within 2 miles | Nearest competitor is 5+ miles away |
| Bay footprint | 35+ feet available for conveyor | Under 30 feet; site constraints |
| Operating model | Willing to staff attendants | Need 24/7 unattended operation |
| Capital availability | $150K–$300K+ available | Cannot justify capex at current volume |
Conversion costs typically range from $150,000 to $300,000+ for a mini-tunnel package including conveyor, wash modules, dryers, and controllers. This does not include pay stations, water pre-treatment, vacuums, signage, installation, freight, or sales tax. For a detailed breakdown of construction and equipment costs by format, consult a comprehensive car wash cost guide that covers equipment pricing, site work, and total project budgets.
For sites where conversion makes sense, the tunnel car wash equipment should be selected based on a three-year revenue target — not just opening-day traffic. Operators who size their equipment to current volume and upgrade later consistently lose revenue during the gap period between when demand outgrew capacity and when the upgrade was finally completed.
The Water Treatment Factor
Both optimization and conversion strategies have an environmental component that operators cannot afford to ignore in 2026. Water recycling regulations are tightening across jurisdictions, and the cost of non-compliance — fines, shutdowns, or denied permits — can dwarf the cost of a reclaim system.
For IBA operators, water treatment serves two functions:
- Compliance: Many jurisdictions now require 60–85% water recycling for new or modified wash installations. An IBA without a reclaim system may not be permitted to operate or expand.
- Cost reduction: Water and sewer costs typically consume 8–15% of gross revenue for an IBA. A reclaim system that recovers 80% of wash water can reduce this to 3–5%, saving $12,000–$25,000 per year on a $150,000-revenue site.
For operators considering conversion or upgrade, integrating a water treatment and recycling system into the equipment package from the start is significantly cheaper than retrofitting later. The cost of deferring water treatment installation is typically 2–3x the initial integration cost when done as an afterthought.
Strategies by Buyer Type
Different buyer types face different throughput challenges. Here is how the strategies above apply to each:
Gas Stations and Convenience Stores
Gas-site IBAs benefit from the highest baseline volume (17,600 cars/year benchmark) but often suffer from the lowest average revenue per car ($9.00). The priorities:
- Pay-at-pump integration is the highest-ROI investment — it turns every fuel customer into a potential wash customer with one button press.
- Membership enrollment at the pump — offer fuel discount bundles that include wash membership. This is the model that chains like Weigel’s and Tiger Fuel have used to sign 1,000+ members in weeks.
- Value-added products — gas-site IBAs often run basic wash programs only. Adding a ceramic/tire-shine top tier immediately lifts average revenue per car.
- Attachment rate optimization — the percentage of fuel customers who also buy a wash. Industry benchmarks range from less than 3% (poor) to 12%+ (excellent). Every percentage point of attachment rate improvement on a site pumping 100,000 gallons/month is worth $15,000–$25,000 in additional annual wash revenue.
For gas stations evaluating equipment upgrades, a touchless in-bay system is typically the default choice — it offers paint-safe washing (critical for customer trust at a fuel site), low maintenance, and the ability to run 24/7 unattended.
Fleet Operators
Fleet operators use IBAs differently — throughput is about scheduling efficiency, not customer acquisition. A fleet of 200 vehicles that needs weekly washing requires 200 washes/week, or roughly 29 washes/day. At 10 cars/hour, that is 3 hours of bay time per day.
- Cycle time is the primary lever — reducing from 6 minutes to 4 minutes per wash cuts daily bay time from 3 hours to under 2 hours, freeing capacity for additional fleet contracts.
- Off-peak scheduling — fleets can wash during overnight or early-morning hours when consumer demand is zero, effectively getting “free” capacity.
- Commercial vehicle compatibility — standard IBAs may not accommodate larger fleet vehicles (vans, box trucks). Operators serving fleets should evaluate commercial vehicle wash systems or at minimum ensure their IBA clearance specs match the fleet profile.
- Chemical optimization for fleet soil profiles — fleet vehicles often carry heavier road grime, grease, or industrial residue. Standard consumer wash chemistry may not deliver acceptable results. Custom chemical programs tailored to fleet soil profiles improve both quality and cycle time (fewer re-washes).
Car Dealers and Distributors
Dealers use IBAs for lot car preparation and customer delivery preparation. Throughput here is about turnaround time — getting a vehicle from dirty to delivery-ready as fast as possible.
- Paint safety is non-negotiable. A dealer cannot risk brush swirl on a $50,000 vehicle headed to a customer. Touchless systems are the standard for dealer applications.
- Water quality matters more than for consumer washes — hard water spots on a showroom vehicle are unacceptable. Water softening and spot-free rinse systems are essential, not optional. For guidance on this, see the water treatment solutions designed for professional wash sites.
- EV safety — dealers handling electric vehicles need wash systems that are safe for EVs. For a comparison of brushless and touchless approaches to EV washing, see this analysis of EV-safe car wash methods.
- Volume is lower but margin per wash is higher — dealers are not running 20,000 washes/year through their IBA. They might run 2,000–5,000. But each wash is tied to a vehicle sale or service appointment, making the value per wash significantly higher than a consumer transaction.
Investors and Multi-Site Operators
Investors approach IBA throughput from a portfolio perspective — optimizing across multiple sites, standardizing equipment, and preparing for exit.
- Standardization across the portfolio — using the same equipment manufacturer, chemical program, and membership platform across all sites reduces maintenance costs, simplifies staff training, and creates consistent financial reporting.
- Membership as a valuation driver — sites with strong membership programs command higher EBITDA multiples at sale. A site with 500 active members at $30/month generates $180,000 in predictable annual recurring revenue, which directly supports a higher valuation. For the relationship between membership economics and business value, see this ROI analysis of wash system choices.
- Conversion timing — investors should monitor each site’s volume trajectory and initiate conversion planning when annual washes approach 25,000. Waiting until the site is at capacity (and customers are leaving due to wait times) means lost revenue during the 4–6 month conversion construction period.
- Portfolio-level water treatment strategy — standardizing water recycling across all sites ensures compliance consistency and creates economies of scale in maintenance and chemical supply.
For investors evaluating new acquisitions, examining the portfolio of completed wash installations can provide reference points for equipment configurations, site layouts, and throughput benchmarks across different market types.
The Combined Effect: What Optimized Looks Like
If an IBA operator implements all of the strategies above — value-added products, pricing optimization, membership, payment friction reduction, amenities, cycle-time optimization, and water treatment — what does the financial picture look like?
| Metric | Baseline (Average IBA) | Optimized IBA | Change |
|---|---|---|---|
| Average revenue per car | $10.19 | $14.50–$16.00 | +42% to +57% |
| Cars per hour (optimized cycle) | 9–10 | 13–15 | +44% to +50% |
| Annual washes | 17,600 | 22,000–26,000 | +25% to +48% |
| Annual gross revenue | $179,000 | $319,000–$416,000 | +78% to +132% |
| Expense ratio | 44% | 38–40% | −4 to −6 pts |
| Net operating income | $100,000 | $191,000–$250,000 | +91% to +150% |
Note: These figures represent a well-executed optimization program at a gas-site IBA with baseline volume of 17,600 washes/year. Results vary by market, equipment age, and competitive environment.
The expense ratio improvement — from 44% to 38–40% — comes from the amortization of fixed costs (rent, insurance, equipment depreciation) across a larger revenue base. The variable cost per car actually increases slightly (more chemicals for premium packages), but the contribution margin per car improves because the price increase outpaces the cost increase.
Common Mistakes
- Chasing volume before revenue per car. Many operators focus on washing more cars without first optimizing what they earn per car. A site washing 20,000 cars at $10/car generates $200,000. A site washing 15,000 cars at $15/car generates $225,000 — with less wear on equipment, less water consumption, and less labor.
- Underpricing the top tier. If the top wash package is only $2 more than the mid-tier, no one buys it — and the operator leaves $3–$5/car on the table for the 20% of customers who would have paid more. Top-tier pricing should be ambitious; the membership tier spacing strategy above shows how to make it attractive without making it feel unattainable.
- Ignoring the membership threat. When a tunnel opens nearby with membership pricing, operators who respond with “our customers are loyal” lose 30–40% of their base within weeks. The response must be pre-emptive — a membership program should be in place before the tunnel opens, not after.
- Treating the kiosk as an afterthought. A slow, confusing payment kiosk costs more in lost throughput than the kiosk itself costs to replace. The kiosk is the customer’s primary interaction with the business — it should be fast, intuitive, and well-maintained.
- Not tracking per-car chemical cost. Operators who do not know their chemical cost per car to the penny cannot make informed pricing decisions. Chemical costs of $0.50–$1.50/car represent 5–15% of revenue — too significant to manage by feel.
- Converting to a tunnel without labor planning. A mini-tunnel requires 2–4 attendants per shift. Operators who convert without budgeting for $40K–$80K/year in additional labor costs are surprised when the net income improvement is smaller than the gross revenue increase suggested.
- Deferring water treatment. The cost of retrofitting a reclaim system into an operating site is 2–3x the cost of integrating it during initial installation or equipment replacement. Operators who defer water treatment are not saving money — they are deferring a larger expense.
Conclusion
The in-bay automatic is not a dying format. It is a format under pressure — and pressure, properly channeled, produces diamonds. The operators who will thrive in 2026 and beyond are those who recognize that the IBA’s structural advantages — 24/7 unattended operation, lower capital investment, simpler maintenance, and natural integration with fuel retail — are real and durable. But these advantages are only monetized when paired with aggressive revenue optimization, membership programs, cycle-time discipline, and a willingness to invest in amenities that match what express tunnels offer.
The throughput gap between an IBA and an express tunnel will never fully close — that is a structural reality of the equipment architecture. But the revenue-per-car gap can close substantially, and the net operating income gap can narrow to the point where the IBA’s lower fixed costs make it the more profitable choice in many markets.
For operators evaluating equipment options — whether upgrading an existing IBA, adding a second bay, or considering conversion to a mini-tunnel — the right approach is to consult multiple equipment suppliers, compare total cost of ownership rather than sticker price, and size the decision to a three-year revenue target rather than current volume. Manufacturers like Mattias Car Wash Systems and others in the market can provide site-specific guidance, but the strategic framework above should drive the decision — not any single supplier’s recommendation.
Sources: Auto Laundry News operator surveys (2023–2024); International Carwash Association Q4 2025 Pulse report; IBISWorld U.S. Car Wash Services Market data (2025); Bob Roman / RJR Enterprises consulting analysis; AVW Equipment in-bay conversion case study (Bainbridge, GA, 2025); CamelConvey California conveyor upgrade case study; operator-reported data from industry forums (2024–2026); Fortis Foam wash throughput benchmarks; HyTian Car Wash throughput optimization analysis; CCW Solutions traffic flow and stacking guidelines; Mattias Car Wash Systems operator data and product specifications.
Disclaimer: This article is based on publicly available industry data and operator-reported figures. Revenue, cost, and throughput benchmarks vary significantly by market, equipment type, equipment age, and operating conditions. Financial decisions should be made with site-specific analysis and professional advisory input.